
Telemetry
Overview
Section titled “Overview”DeepIntShield provides built-in telemetry and monitoring capabilities through Prometheus metrics collection. The telemetry system tracks both HTTP-level performance metrics and upstream provider interactions, giving you complete visibility into your AI gateway’s performance and usage patterns.
Key Features:
- Prometheus Integration - Native metrics collection at
/metricsendpoint - Comprehensive Tracking - Success/error rates, token usage, costs, and cache performance
- Custom Labels - Configurable dimensions for detailed analysis
- Dynamic Headers - Runtime label injection via
x-deepintshield-prom-*headers - Cost Monitoring - Real-time tracking of AI provider costs in USD
- Cache Analytics - Direct and semantic cache hit tracking
- Async Collection - expensive processing runs outside the response path
- Multi-Level Tracking - HTTP transport + upstream provider metrics
The telemetry plugin moves collection work to background processing. Request-path instrumentation and enqueueing still have bounded overhead, while work that runs after the response does not delay that response. Benchmark the enabled labels and exporters with your traffic shape before setting latency objectives.
Default Metrics
Section titled “Default Metrics”HTTP Transport Metrics
Section titled “HTTP Transport Metrics”These metrics track all incoming HTTP requests to DeepIntShield:
| Metric | Type | Description |
|---|---|---|
http_requests_total | Counter | Total number of HTTP requests |
http_request_duration_seconds | Histogram | Duration of HTTP requests |
http_request_size_bytes | Histogram | Size of incoming HTTP requests |
http_response_size_bytes | Histogram | Size of outgoing HTTP responses |
Labels:
path: HTTP endpoint pathmethod: HTTP verb (e.g.,GET,POST,PUT,DELETE)status: HTTP status code- custom labels: Custom labels configured in the DeepIntShield configuration
Upstream Provider Metrics
Section titled “Upstream Provider Metrics”These metrics track requests forwarded to AI providers:
| Metric | Type | Description | Labels |
|---|---|---|---|
deepintshield_upstream_requests_total | Counter | Total requests forwarded to upstream providers | Base Labels, custom labels |
deepintshield_success_requests_total | Counter | Total successful requests to upstream providers | Base Labels, custom labels |
deepintshield_error_requests_total | Counter | Total failed requests to upstream providers | Base Labels, reason, custom labels |
deepintshield_upstream_latency_seconds | Histogram | Latency of upstream provider requests | Base Labels, is_success, custom labels |
deepintshield_input_tokens_total | Counter | Total input tokens sent to upstream providers | Base Labels, custom labels |
deepintshield_output_tokens_total | Counter | Total output tokens received from upstream providers | Base Labels, custom labels |
deepintshield_cache_hits_total | Counter | Total cache hits by type (direct/semantic) | Base Labels, cache_type, custom labels |
deepintshield_cost_total | Counter | Total cost in USD for upstream provider requests | Base Labels, custom labels |
Base Labels:
provider: AI provider name (e.g.,openai,anthropic,azure)model: Model name (e.g.,gpt-4o-mini,claude-3-sonnet)method: Request type (chat,text,embedding,speech,transcription)virtual_key_id: Virtual key IDvirtual_key_name: Virtual key namerouting_engines_used: Comma-separated routing engines used (“routing-rule”, “governance”, “loadbalancing”)routing_rule_id: Routing rule ID that matched the requestrouting_rule_name: Routing rule name that matched the requestselected_key_id: Selected key IDselected_key_name: Selected key namenumber_of_retries: Number of retriesfallback_index: Fallback index (0 for first attempt, 1 for second attempt, etc.)- custom labels: Custom labels configured in the DeepIntShield configuration
Streaming Metrics
Section titled “Streaming Metrics”These metrics capture latency characteristics specific to streaming responses:
| Metric | Type | Description | Labels |
|---|---|---|---|
deepintshield_stream_first_token_latency_seconds | Histogram | Time from request start to first streamed token | Base Labels |
deepintshield_stream_inter_token_latency_seconds | Histogram | Latency between subsequent streamed tokens | Base Labels |
Monitoring Examples
Section titled “Monitoring Examples”Success Rate Monitoring
Section titled “Success Rate Monitoring”Track the success rate of requests to different providers:
# Success rate by providerrate(deepintshield_success_requests_total[5m]) /rate(deepintshield_upstream_requests_total[5m]) * 100Token Usage Analysis
Section titled “Token Usage Analysis”Monitor token consumption across different models:
# Input tokens per minute by modelincrease(deepintshield_input_tokens_total[1m])
# Output tokens per minute by modelincrease(deepintshield_output_tokens_total[1m])
# Token efficiency (output/input ratio)rate(deepintshield_output_tokens_total[5m]) /rate(deepintshield_input_tokens_total[5m])
Cost Tracking
Section titled “Cost Tracking”Monitor spending across providers and models:
# Cost per second by providersum by (provider) (rate(deepintshield_cost_total[1m]))
# Daily cost estimatesum by (provider) (increase(deepintshield_cost_total[1d]))
# Cost per request by provider and modelsum by (provider, model) (rate(deepintshield_cost_total[5m])) /sum by (provider, model) (rate(deepintshield_upstream_requests_total[5m]))
Cache Performance
Section titled “Cache Performance”Track cache effectiveness:
# Cache hit rate by typerate(deepintshield_cache_hits_total[5m]) /rate(deepintshield_upstream_requests_total[5m]) * 100
# Direct vs semantic cache hitssum by (cache_type) (rate(deepintshield_cache_hits_total[5m]))
Error Rate Analysis
Section titled “Error Rate Analysis”Monitor error patterns:
# Error rate by providerrate(deepintshield_error_requests_total[5m]) /rate(deepintshield_upstream_requests_total[5m]) * 100
# Errors by modelsum by (model) (rate(deepintshield_error_requests_total[5m]))
Configuration
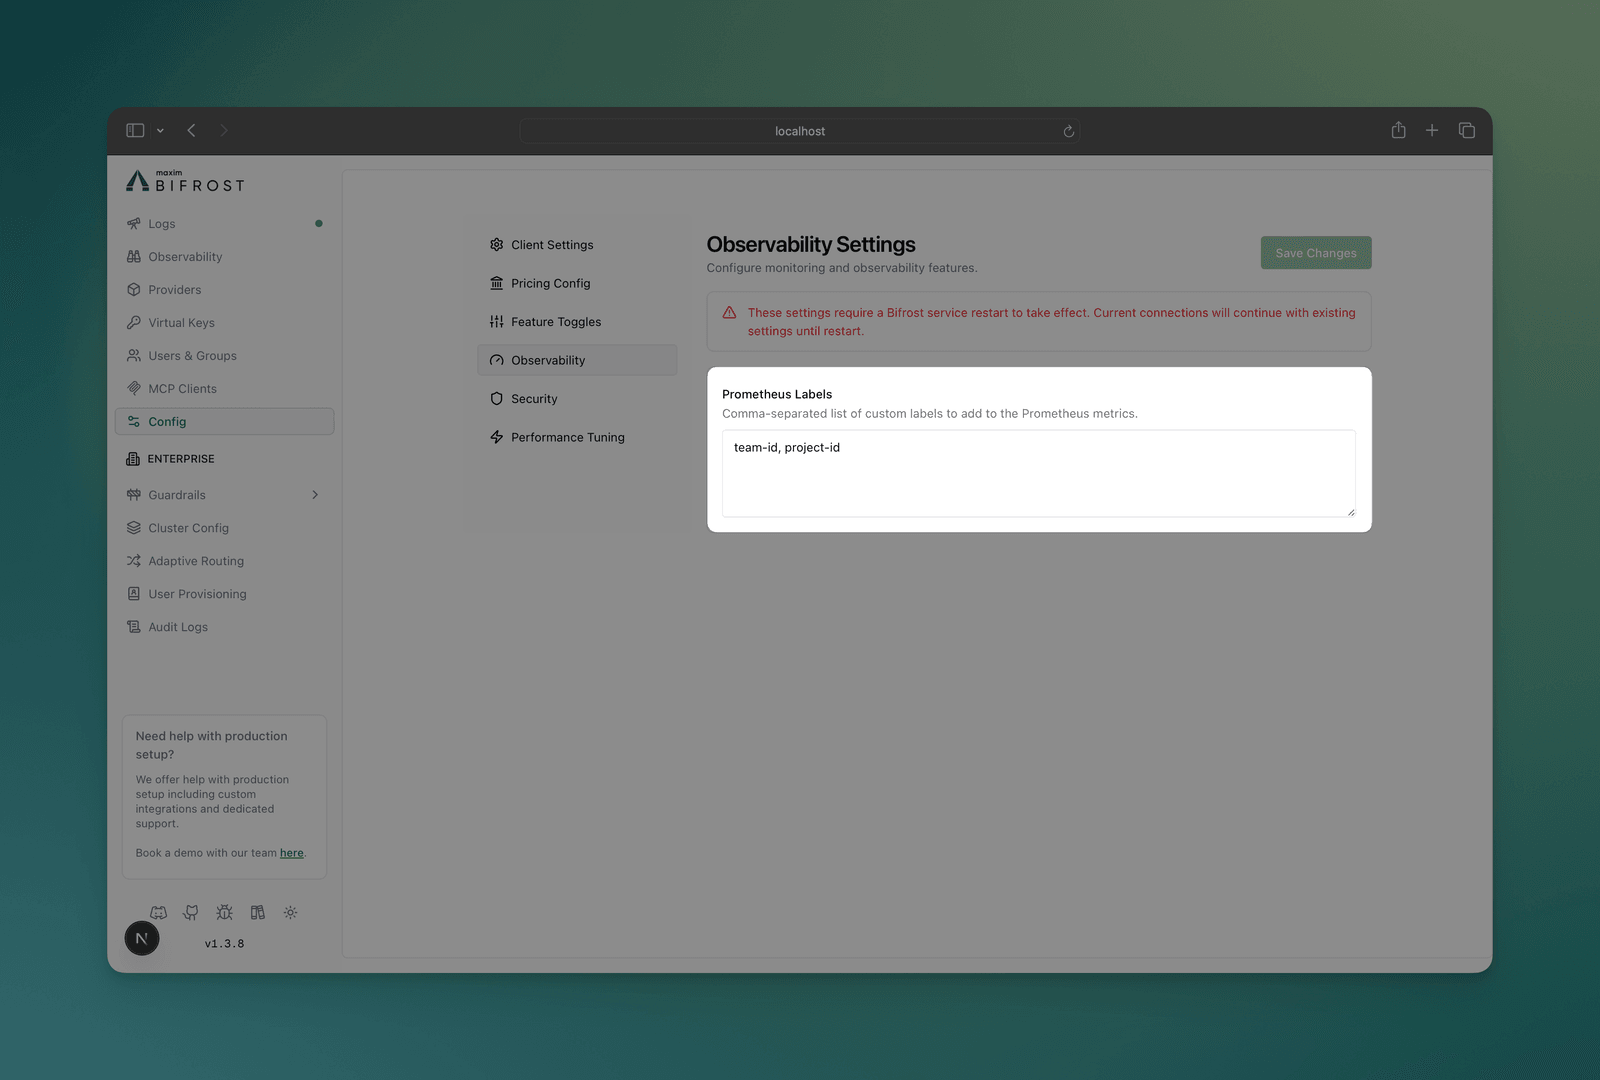
Section titled “Configuration”Configure custom Prometheus labels to add dimensions for filtering and analysis from the Web UI:
-
Navigate to Configuration
- Open DeepIntShield UI at
https://app.deepintshield.com - Go to Config tab
- Open DeepIntShield UI at
-
Prometheus Labels
Custom Labels: team, environment, organization, project
Dynamic Label Injection
Section titled “Dynamic Label Injection”Add custom label values at runtime using x-deepintshield-prom-* headers:
# Add custom labels to specific requestscurl -X POST https://app.deepintshield.com/v1/chat/completions \ -H "Content-Type: application/json" \ -H "x-deepintshield-vk: sk-ds-your-virtual-key" \ -H "x-deepintshield-prom-team: engineering" \ -H "x-deepintshield-prom-environment: production" \ -H "x-deepintshield-prom-organization: my-org" \ -H "x-deepintshield-prom-project: my-project" \ -d '{ "model": "gpt-4o-mini", "messages": [{"role": "user", "content": "Hello!"}] }'Header Format:
- Prefix:
x-deepintshield-prom- - Label name: Any string after the prefix
- Value: String value for the label
Infrastructure Setup
Section titled “Infrastructure Setup”Local Testing
Section titled “Local Testing”To explore the metrics locally, run Prometheus and Grafana alongside your Gateway with a minimal Docker Compose stack, then point Prometheus at the Gateway’s /metrics endpoint:
services: prometheus: image: prom/prometheus:latest ports: - "9090:9090" volumes: - ./prometheus.yml:/etc/prometheus/prometheus.yml grafana: image: grafana/grafana:latest ports: - "3000:3000" environment: GF_SECURITY_ADMIN_PASSWORD: admindocker compose up -d
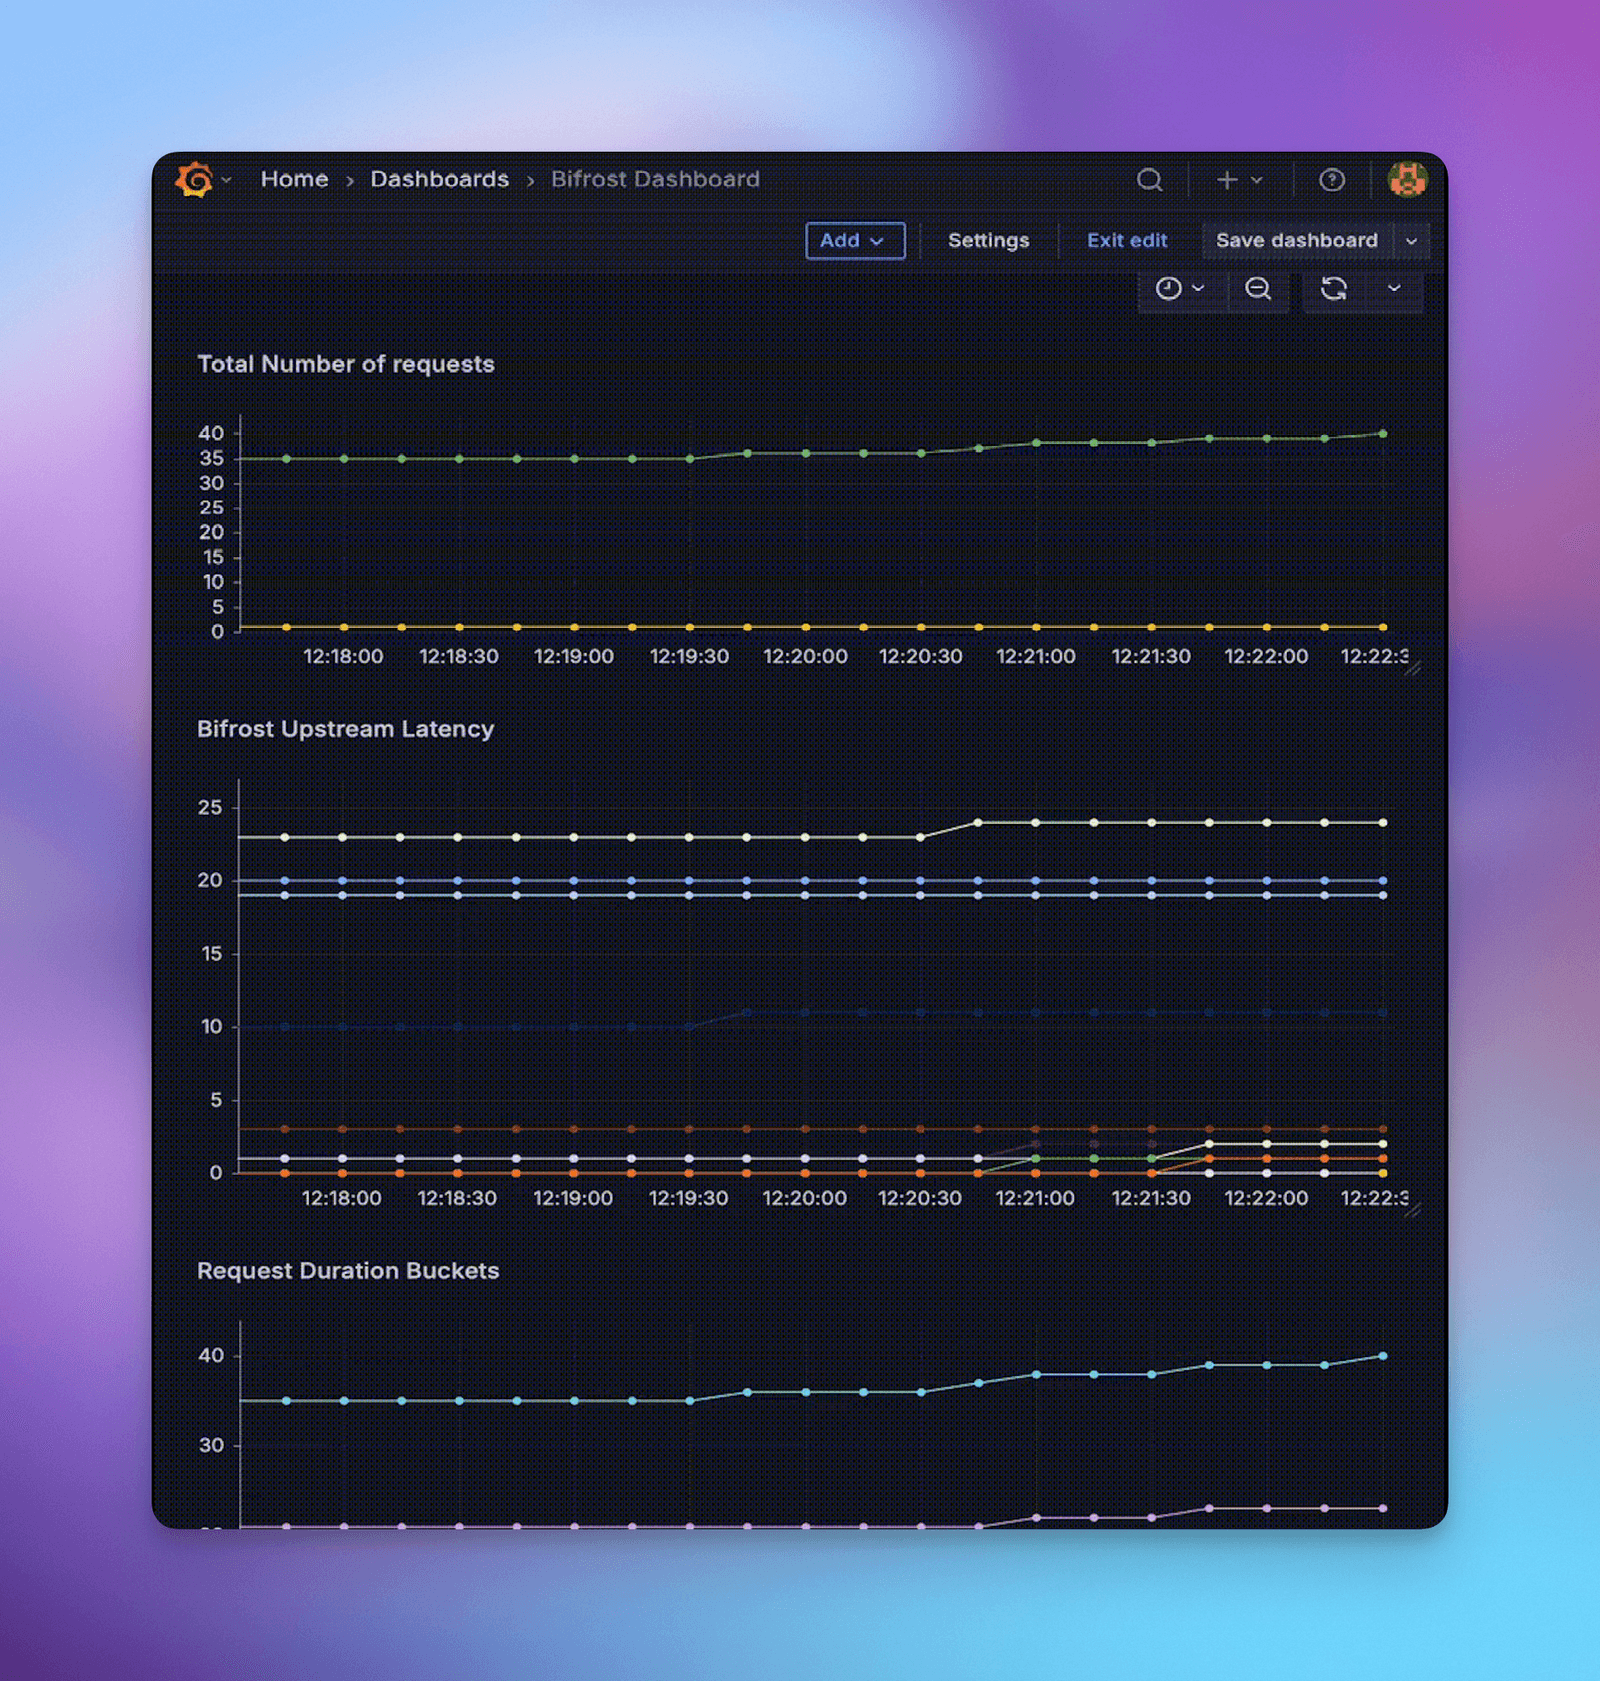
# Access endpoints# Prometheus: http://<your-prometheus-host>:9090# Grafana: http://<your-grafana-host>:3000 (admin/admin)# DeepIntShield metrics: https://app.deepintshield.com/metricsYou can use the Prometheus scraping endpoint to build your own Grafana dashboards. A few examples are shown below.
Production Deployment
Section titled “Production Deployment”For production environments:
- Deploy Prometheus with proper persistence, retention, and security
- Configure scraping to target your DeepIntShield instances at
/metrics - Set up Grafana with authentication and dashboards
- Configure alerts based on your SLA requirements
Prometheus Scrape Configuration:
scrape_configs: - job_name: "deepintshield-gateway" static_configs: - targets: ["deepintshield-instance-1:8080", "deepintshield-instance-2:8080"] scrape_interval: 30s metrics_path: /metrics # If DeepIntShield auth is enabled, add: # basic_auth: # username: '<admin_username>' # password: '<admin_password>'Production Alerting Examples
Section titled “Production Alerting Examples”Configure alerts for critical scenarios using the new metrics:
High Error Rate Alert:
- alert: DeepIntShieldHighErrorRate expr: sum by (provider) (rate(deepintshield_error_requests_total[5m])) / sum by (provider) (rate(deepintshield_upstream_requests_total[5m])) > 0.05 for: 2m labels: severity: warning annotations: summary: "High error rate detected for provider {{ $labels.provider }} ({{ $value | humanizePercentage }})"High Cost Alert:
- alert: DeepIntShieldHighCosts expr: sum by (provider) (increase(deepintshield_cost_total[1d])) > 100 # $100/day threshold for: 10m labels: severity: warning annotations: summary: "Daily cost for provider {{ $labels.provider }} exceeds $100 ({{ $value | printf \"%.2f\" }})"Cache Performance Alert:
- alert: DeepIntShieldLowCacheHitRate expr: sum by (provider) (rate(deepintshield_cache_hits_total[15m])) / sum by (provider) (rate(deepintshield_upstream_requests_total[15m])) < 0.1 for: 5m labels: severity: info annotations: summary: "Cache hit rate for provider {{ $labels.provider }} below 10% ({{ $value | humanizePercentage }})"Next Steps
Section titled “Next Steps”- Prometheus Documentation - Official Prometheus guides
- Grafana Setup - Dashboard creation and management
- Tracing - Request/response logging for detailed analysis